A guide to understanding results and data within Motional.
Individual Participants
To see information and data about an individual Participant select the All Participants option under the Participants tab in the blue/purple sidebar.
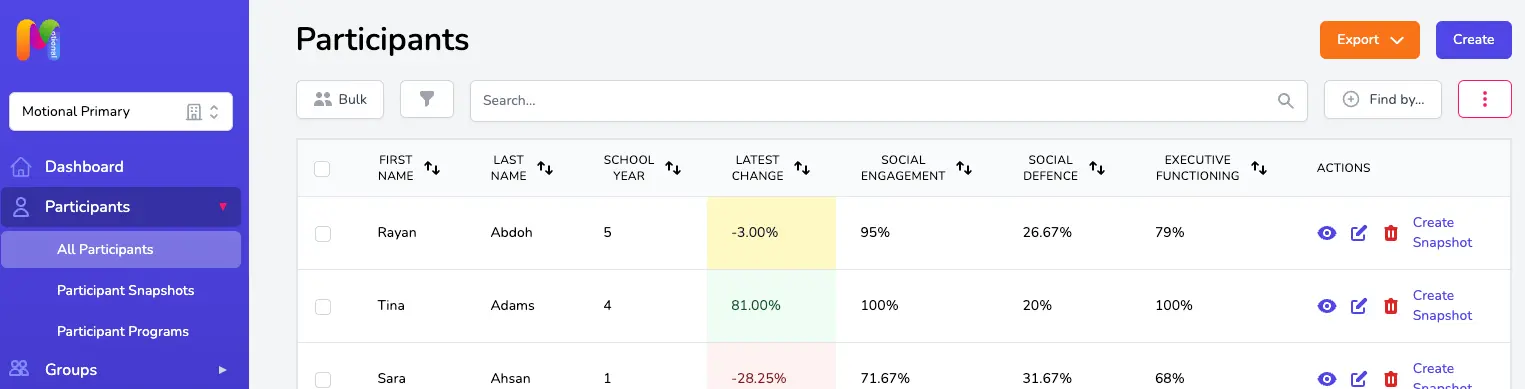
At the top of the Participants table you will find a number of options to help you sort, filter and search for the information and data you want to view.
Using the Bulk option
The Bulk button at the top left of the Participants table allow you to apply the same action to a number of records, for instance adding a number of Participants to a Group.

Filtering
The filter icon at the top left of the Participants table allows you to adjust the horizontal rows (i.e. what Participants are in view) by year, gender, key stage, etc. One of the options is the ability to filter by Participant Tags, particularly useful if you want to look at data specifically for Participants with tags for things like FSM, Pupil Premium or SEMH for instance. Participant tags are added in the Participant record - check out the Adding a New Participant article for more info and guidance.
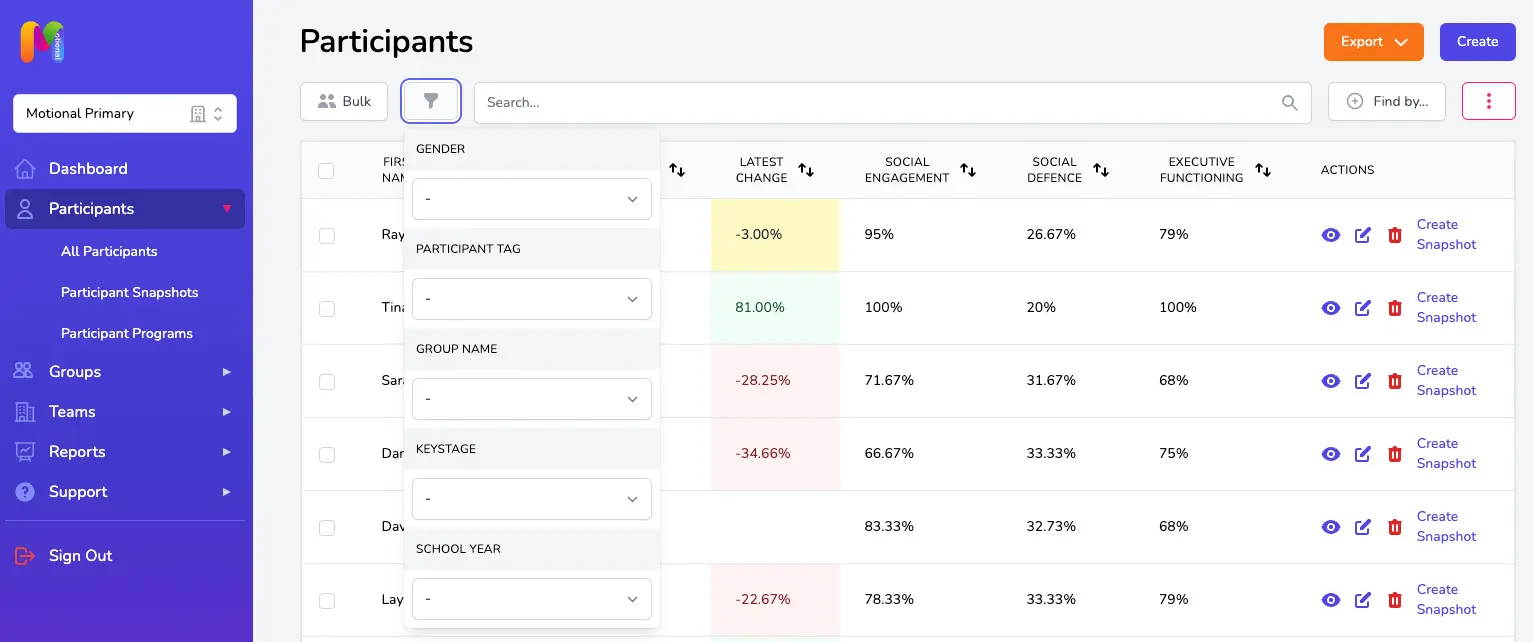
We've recently added a new filter to this page which is the ability to filter by Groups! This is really useful to be able to see a quick overview for each of the Participants in one of your Groups, including the latest change indicator. For settings who have classes or groups that change quite regularly, this now means you'll be able to access a summary that includes the latest data for each of the Participants in the Group, regardless of whether they were included in the latest Groupshot specifically for that Group. Providing the Group itself has been updated to include the correct Participants, you'll be able to use the Group filter to get an overview of latest data at any point during the year. You should be careful to follow the usual rules about changes to Groups though - check out the Making Changes to Groups article first or get in touch if you're unsure!
Using the column selector tool
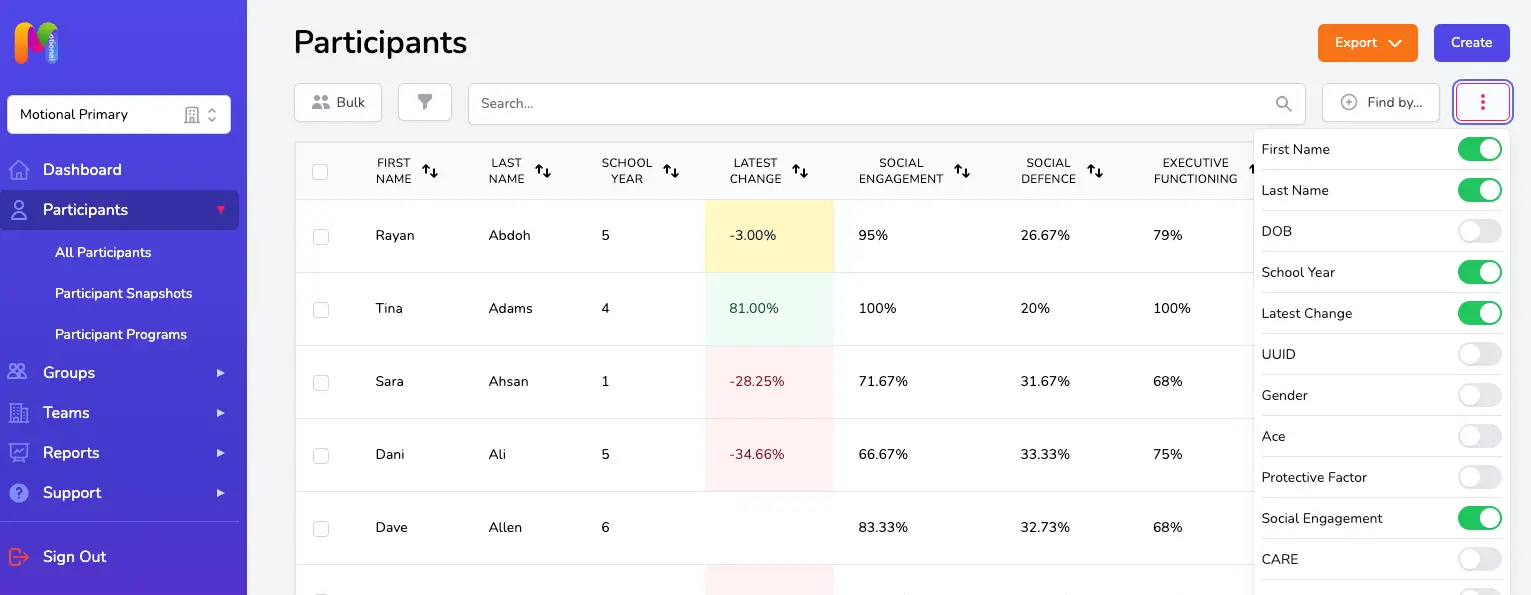
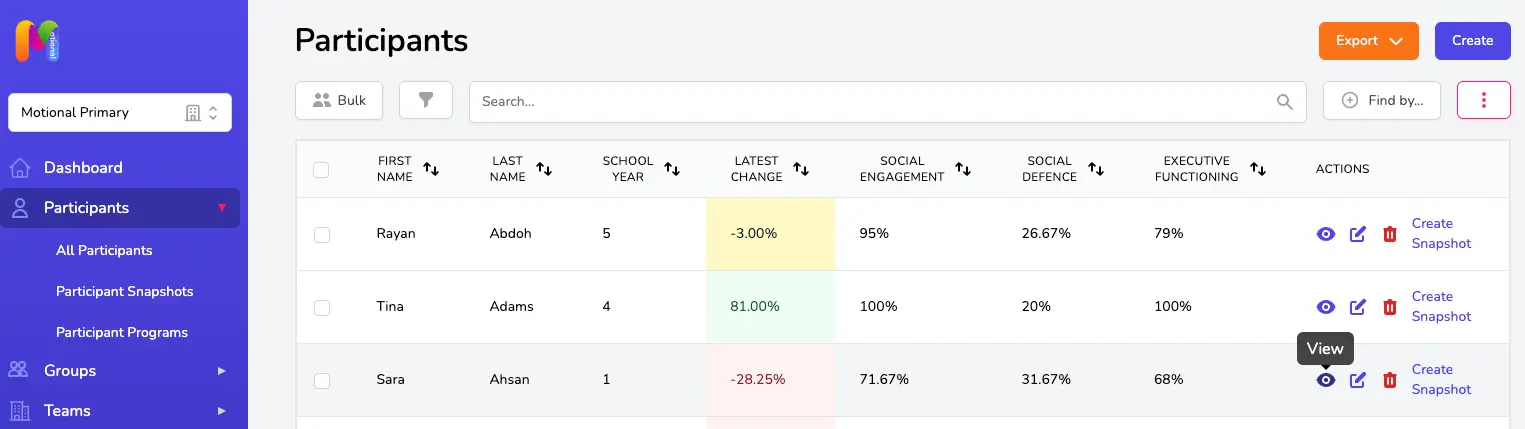
Use the column selector button (the pink square with 3 dots at the top right of the table) to bring additional columns of information into view, or to hide columns. Here you will find things like number of ACEs, Protective Factors, Domain Scores, Latest Change and lots of other options.
Column sorting tool
The sort direction icon reorders the list in the table. You'll find it at the top of any column that contains sortable information. The icon will be highlighted in pink/red if that column is currently being sorted.
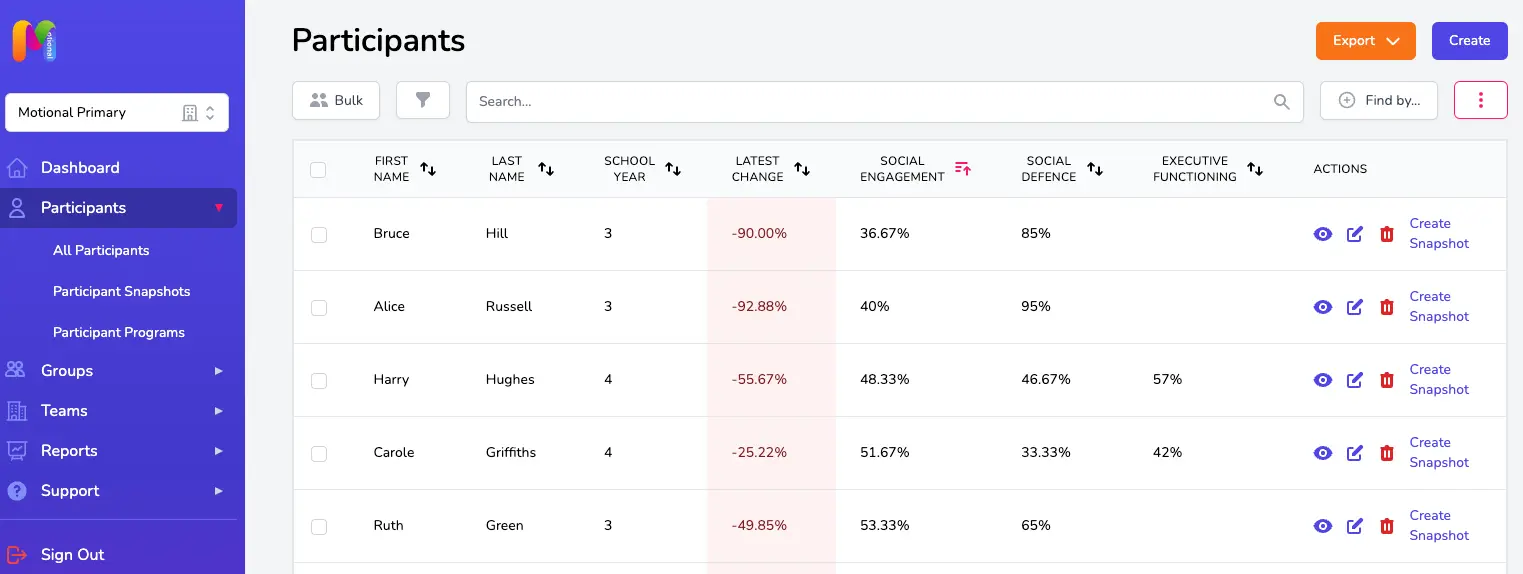
Using those features in combination offers huge flexibility in viewing your Participant information and data. For example, you could sort your table using the filter icon to show Year 6, and Male, and FSM. And then reorder the list to bring those with the highest Social Defence Domain scores (RAGE/FEAR/PANIC & GRIEF) to the top. You might then select all the Participants showing and use the Bulk feature to create a Group for intervention work.
Latest Change
The Latest Change column shows change in a Participant's latest two scores recorded in either a Snapshot or Groupshot.
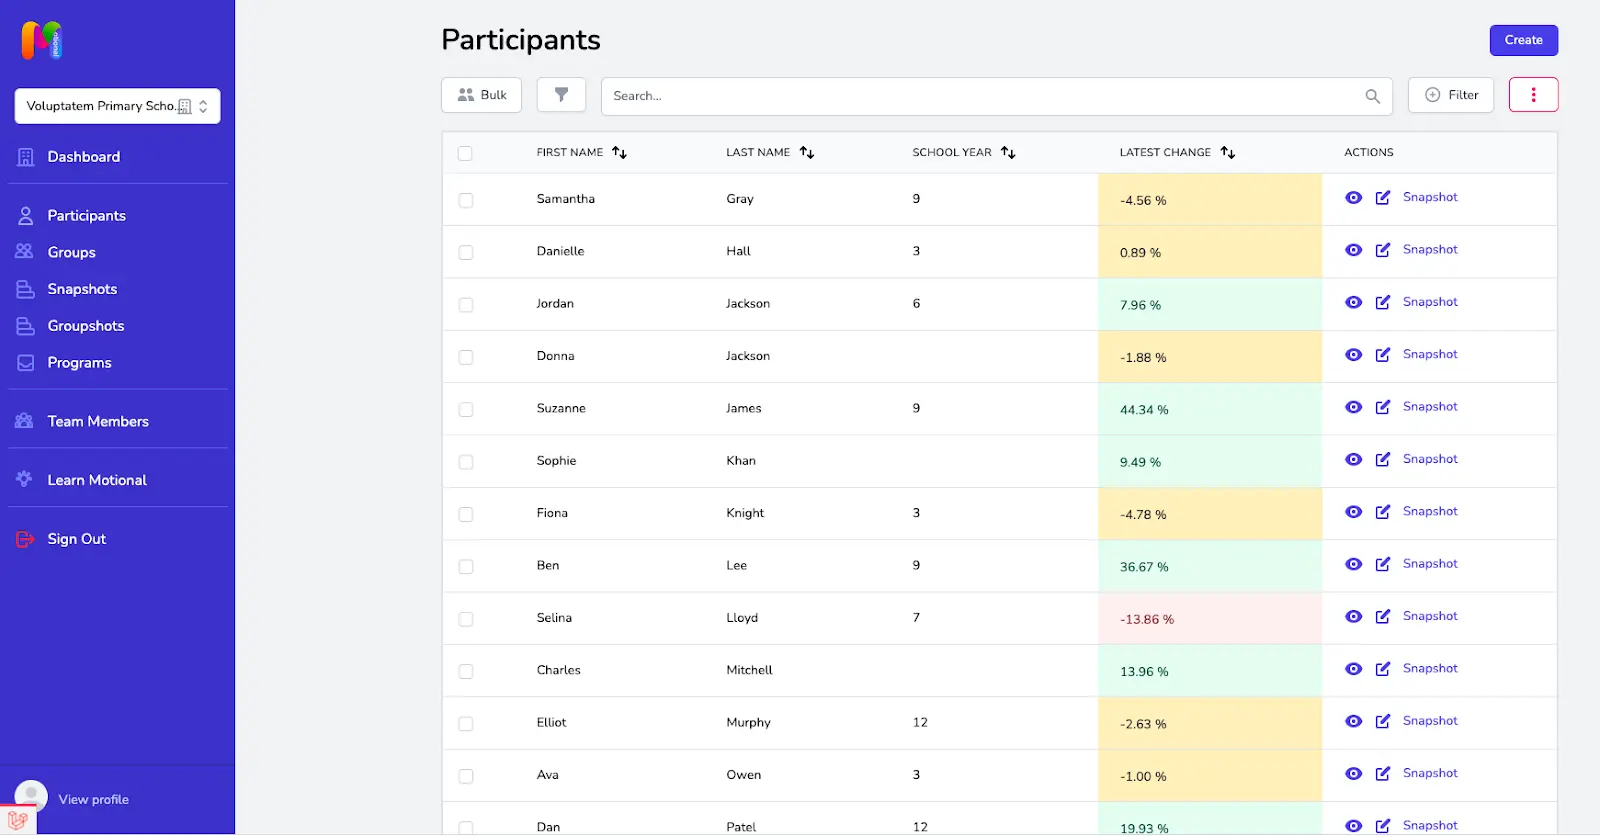
- Minor changes in score show in amber with a + or - sign showing whether the change is positive or negative.
- Significant positive change is shown in green
- Significant negative change is shown in red
Positive change is increasing Social Engagement and Executive Functioning scores and/or reducing Social Defence scores. Negative change is decreasing Social Engagement and Executive Functioning scores and/or increasing Social Defence scores.
Participant Change Over Time Graph
To see change over time for an individual Participant, go to the Participants page and select the view button next to the Participant you want to see.
This will take you to the Participant Profile page. In the "Results over time" section at the top, you can add or remove different information from the chart using the toggles at the top right.
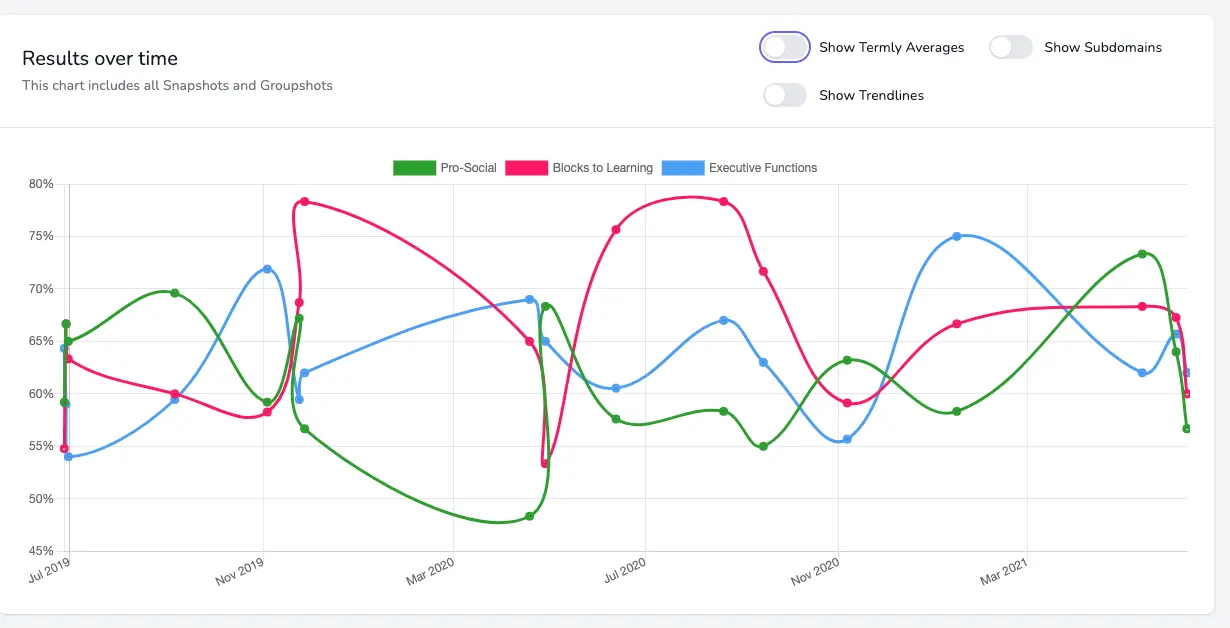
The Show Subdomains toggle allows you to view by Subdomain scores (CARE,FEAR,Sense of Self, etc.) rather than Domain scores (Social Engagement, Social Defence, Executive Functioning) which is the default display. You can select and deselect each Domain or Subdomain by clicking on their title.
The Termly Average adapts the view and can ‘smooth out’ peaks in score caused by short-term environmental or relationship impacts.
Trendlines (which can be applied at any view level) show the direction of travel. Remember an upward trend is good news in both Social Engagement and Executive Functioning, but we are looking for a downward trend in the Social Defence Domain.
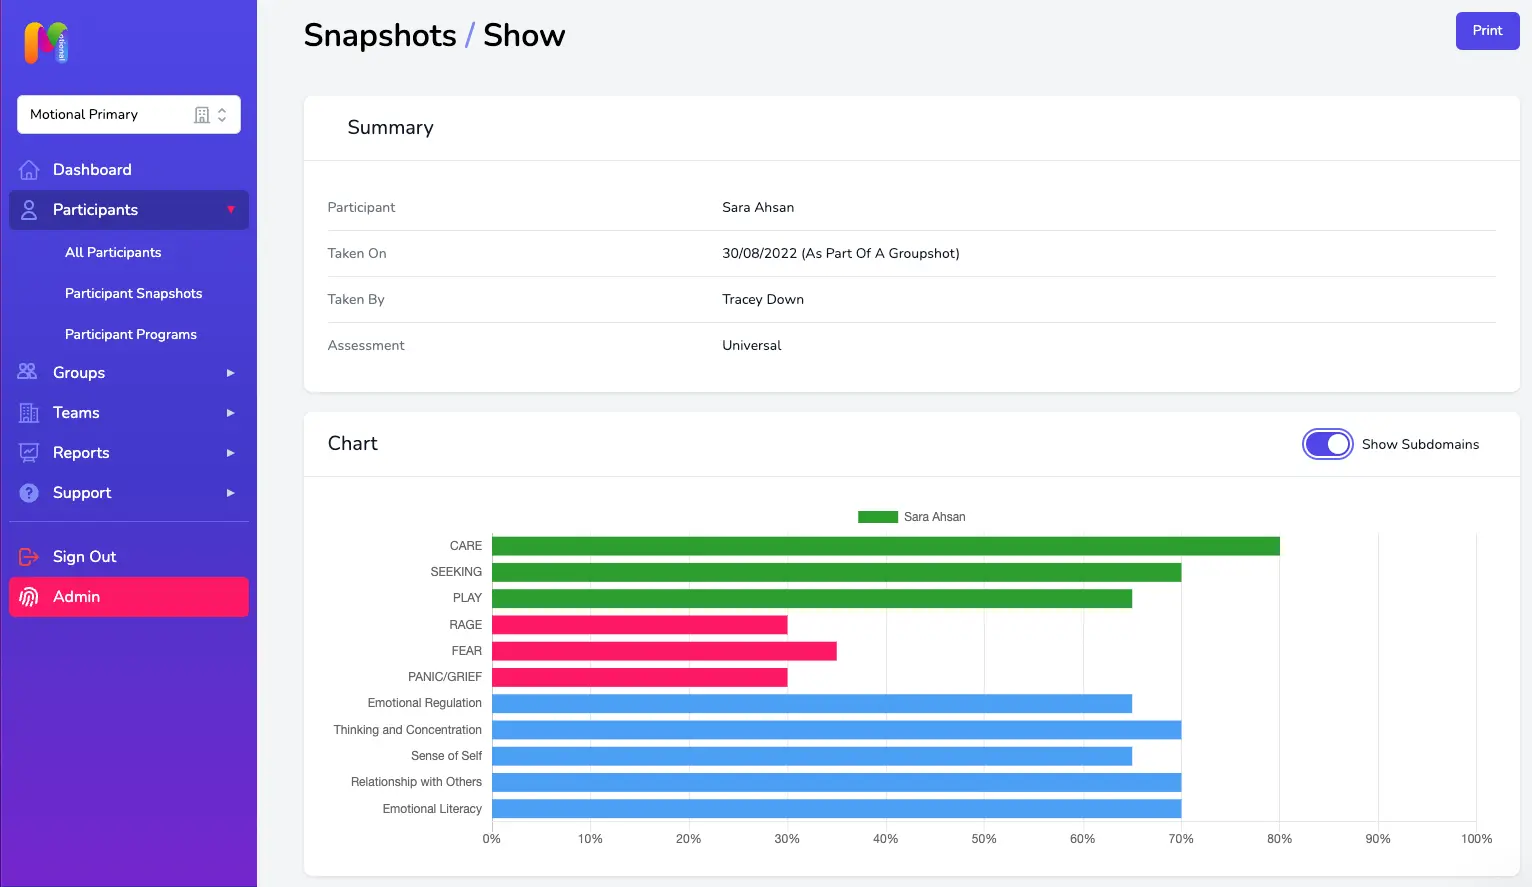
Participant Snapshot results
To see scores and information relating to a particular Snapshot, head to the Snapshots page. You can use the sort, find and filter icons to find the Snapshot you want to view if you need to. Use the View icon (the one that looks like an eye!) to view the Snapshot results.
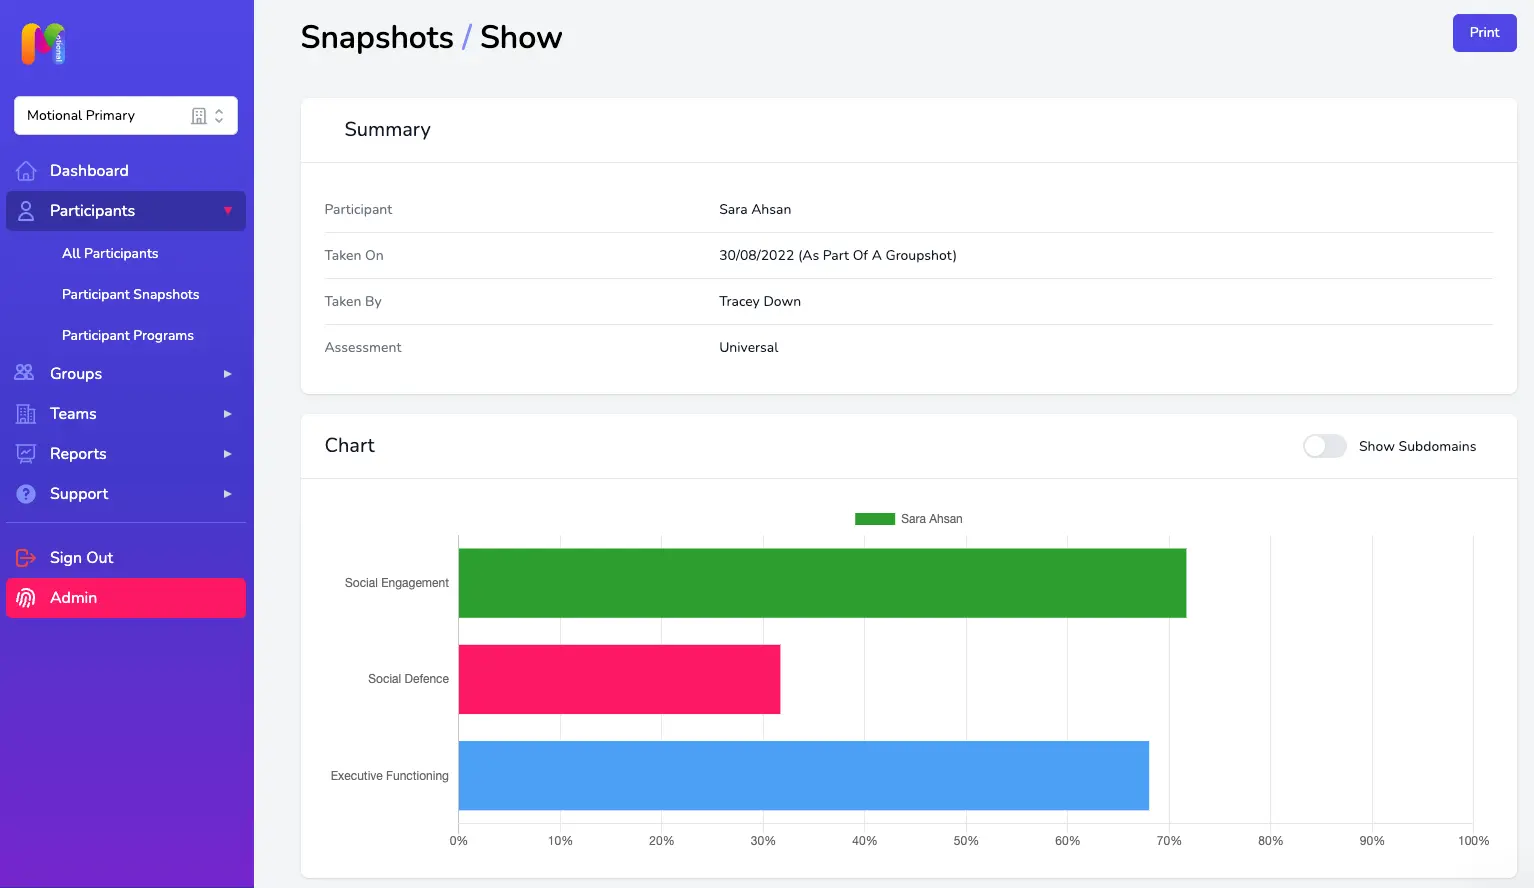
The default view shows the Domain Scores, but you can select the Show Subdomains toggle if you want to view the chart in more detail, with the scores for each of the Subdomains included.
Groups
To see information and data about a Group go to the Groups page and select the view icon to the right of the one you're looking for.
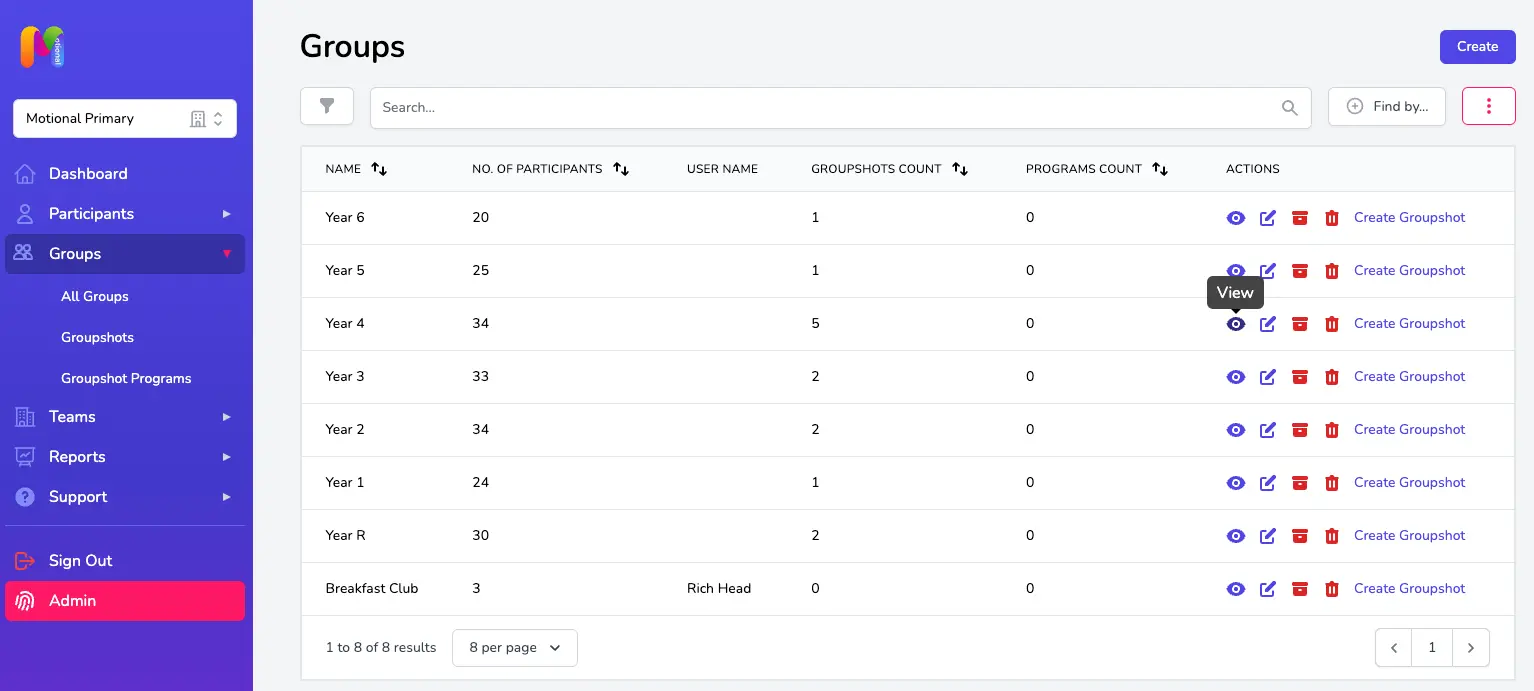
If you want to look at data and information for the Groupshots for that Group you'll find them listed within the Groupshots section further down that page and you can click on them to view them directly from there. A full list of your Team's Groupshots can be viewed by heading to the Groupshots page under the Groups tab in the sidebar.
To view the Groupshot summary click on the view button within the Actions column for the Groupshot you want to look at. Like for the individual Snapshot summary page, you can use the Show Subdomains toggle to switch between Domains and Subdomains scores.
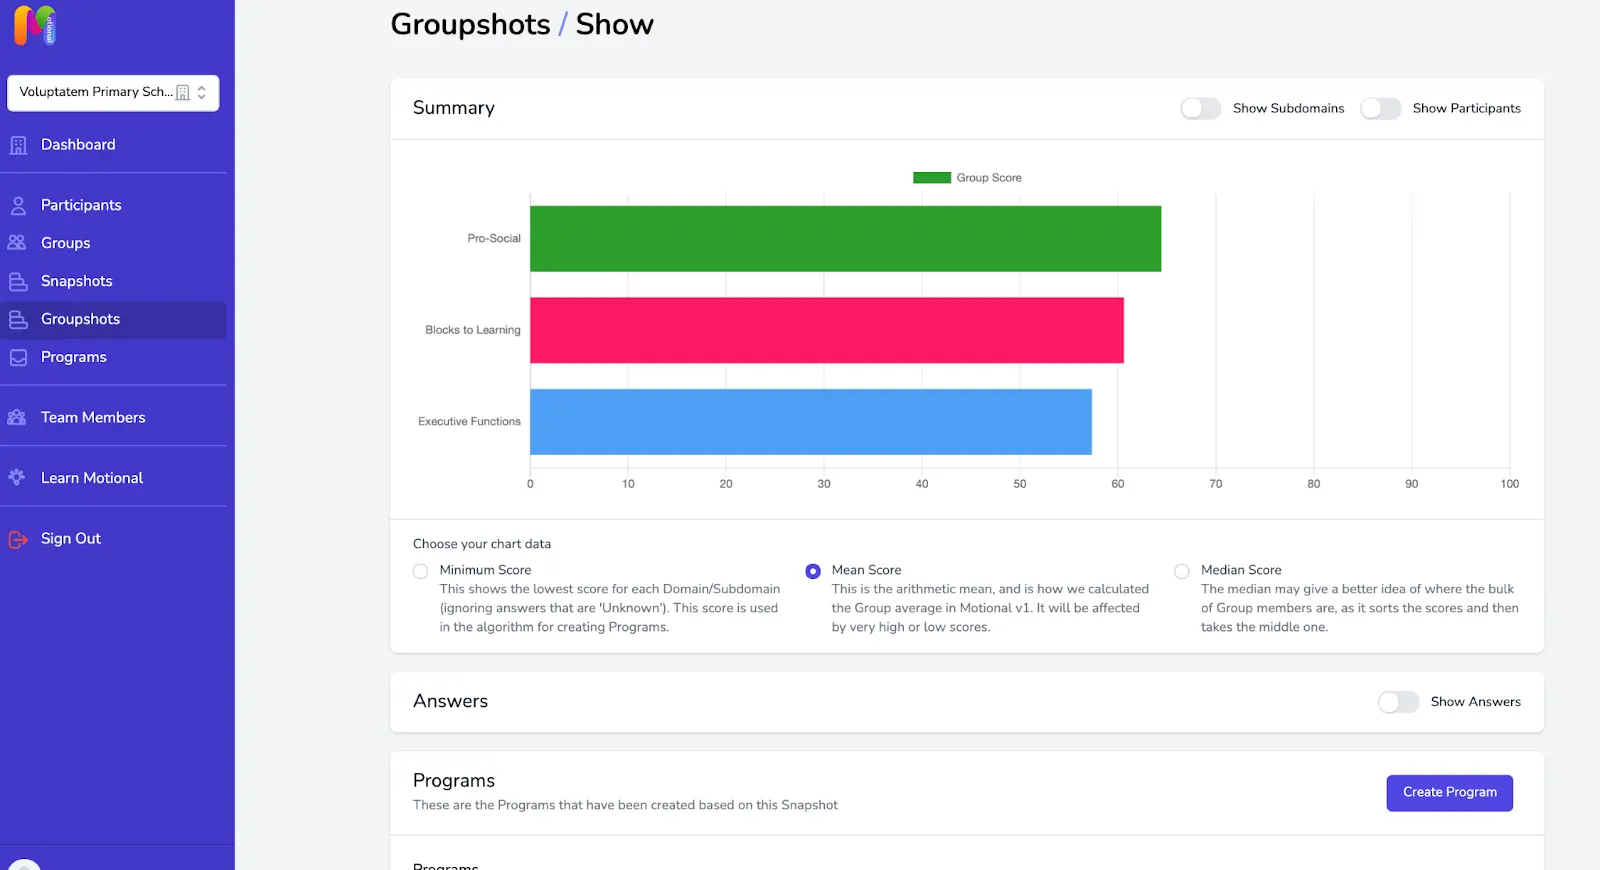
You can view the chart using Mean, Median or Minimum scores by selecting the relevant button (an explanation is given next to each).
By default; we use Median to calculate averages within Motional as this is less sensitive to outliers in the data. (That means it gives a truer perspective of the central tendency of the group.)
Using the Show Participants toggle will allow us to compare the individuals in the Group to the average Group score:
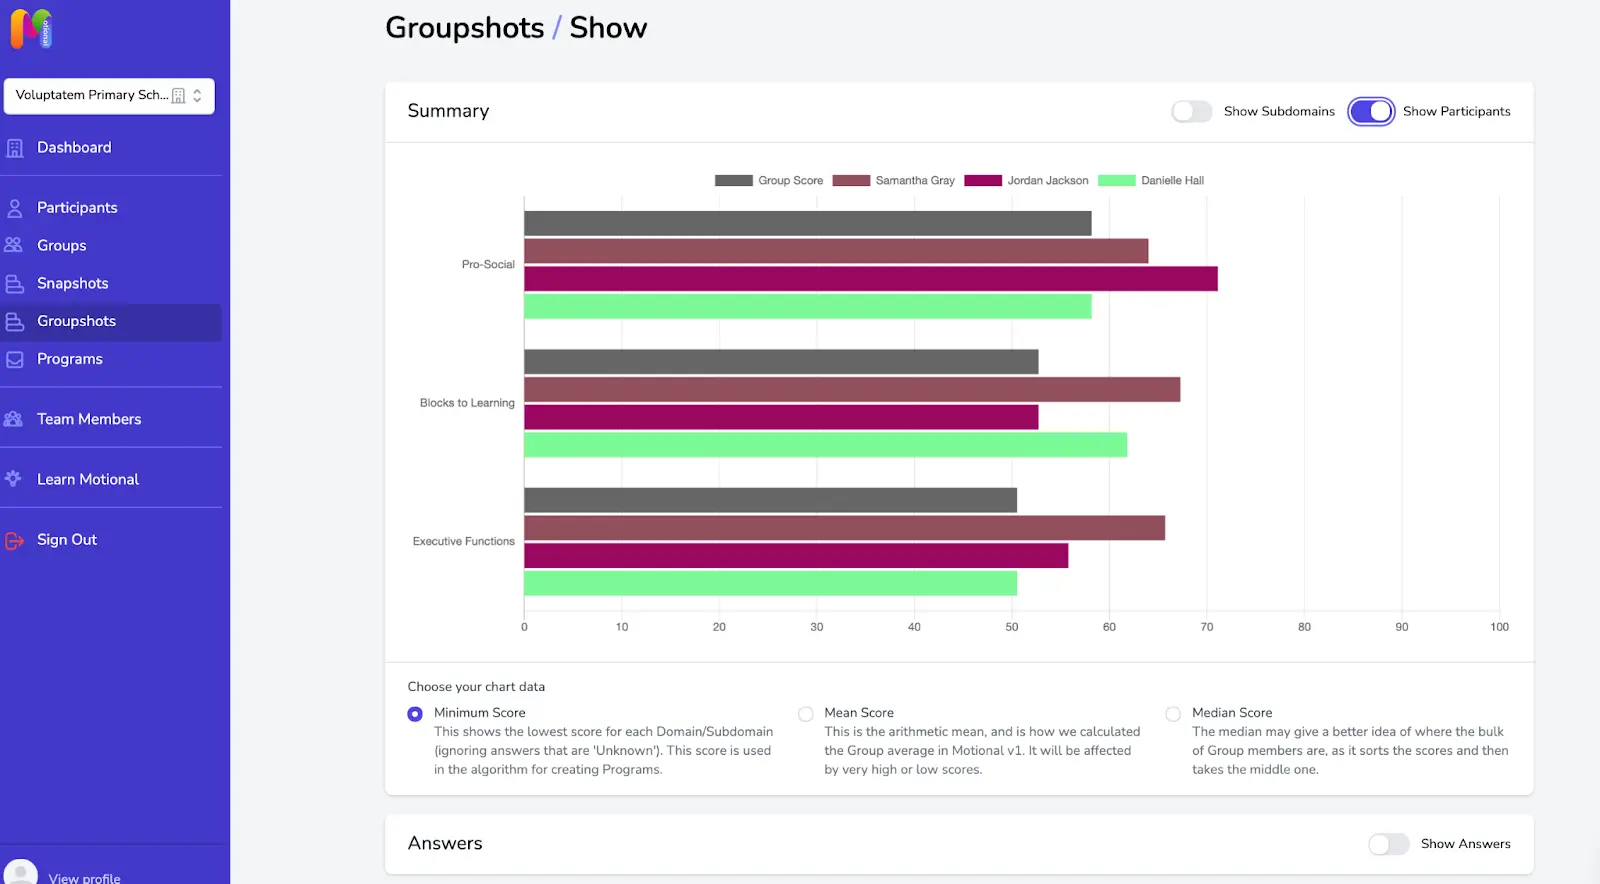
Clicking on the Participant names will bring them in and out of view allowing you to compare each member of the group to the group average.

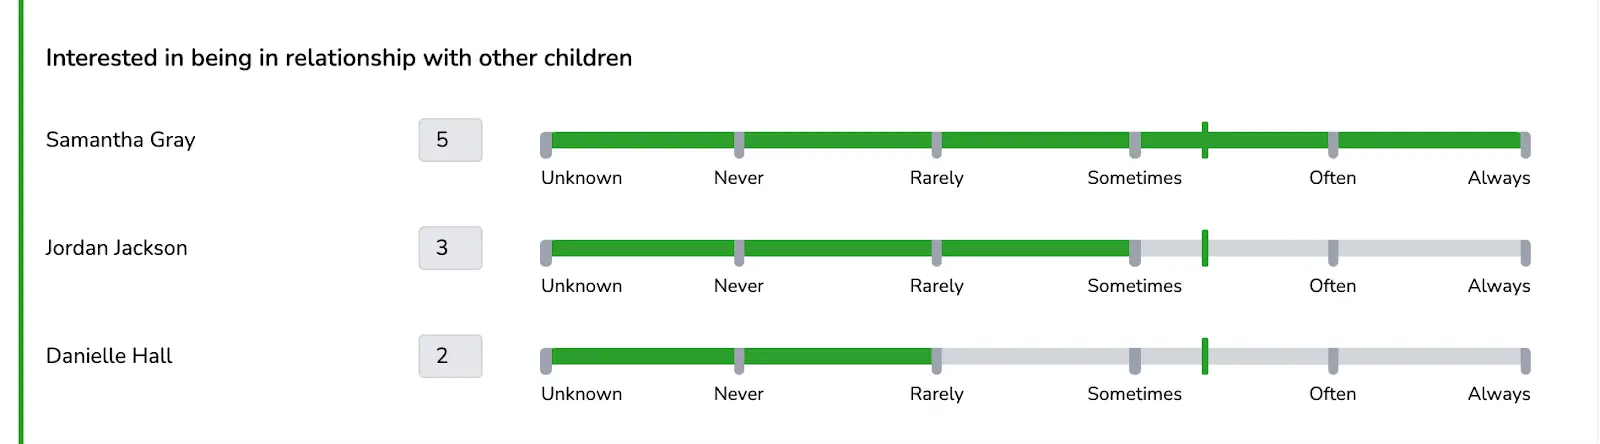
If you click on the Show Answers toggle you can look in even more detail at how each individual question was answered for each Participant within the Group, and how it compared to the group mean, median or lowest score. The Group average score for each question is shown by the vertical coloured indicator on the answer slider.
Key Points and Reminders
- Change over time might include factors that are not directly linked to the work that you’re doing with the child / young person; it could be that a life event or other situation (Relationship/Environment) is affecting their results.
- You can only see change over time if 2 or more Snapshots or Groupshots have been completed for the same Participant or Group